Ilya Zaslavsky, Joshua Tran, Ashraf Memon, Amarnath Gupta, Bertram
Ludaescher, Maryann Martone
San Diego Supercomputer Center
University of
California San Diego
La Jolla, CA 92093-0505
U.S.A.
e-mail: zaslavsk@sdsc.edu
phone:
1-858-534-8342
fax: 1-858-534-5113
Keywords: Interactive Mapping with SVG; AxioMap; SVG-GUI; Information Integration; Spatial Query; Web Services
Abstract
XML-based vector rendering technologies revolutionize the ways we interact with spatial databases, by making it possible to develop intelligent and lightweight map clients easily integrated with other standards-based software. In this paper, we explore SVG-based interfaces in two applications. One is online mapping of multiple information layers reflecting quality of life and public health variables as part of a community web portal and data warehousing project, and as part of information mediation system for heterogeneous spatial sources. The other is development of interactive online brain atlases (rat brain, mouse brain) integrated with other neuroscience sources and databases on the Internet. SVG (and previously, VML)-based clients have been used in these systems for dynamic display of multiple point, line and area layers, thematic mapping, object markup, as well as for formulation of graphic portions of user queries and visualization of query results.
The paper has two main parts. Following the introductory discussion of web mapping architectures, we describe AxioMap (Application of XML for Interactive Online Mapping), a generic VML/SVG-based map publishing kit. The software was developed by the first author of this paper at ELZA Research (see http://www.elzaresearch.com/landv for demos). The second part reflects an ongoing research project at San Diego Supercomputer Center; it explores an SVG client for a brain atlas, focusing on spatial database construction from unorganized SVG sources.
The OpenGIS "Web Map Server Interface Specification" [5] described three general architectures for Web mapping. The most common "picture case" refers to map servers generating map images in response to a standard set of requests. At the other extreme is the "data case", where GIS and mapping functionality is implemented at a "fat" client. Choosing the best architecture in each case depends on several factors, including available bandwidth, price of hardware and software, graphic quality, interactivity, and the server and client side compatibility considerations. In the "picture case" approach, frequent server round-trips for map update are required. Thus, within this architecture, faster access to large amounts of spatial data, for increasing number of simultaneous users, generally requires a more expensive server and network setup. Interactivity and graphic quality considerations (such as the ability to display tooltips, dynamic symbols, object highlighting, zooming/panning, etc.), are much better addressed within the alternative "data case" architecture, where vector data are transferred to the client for map rendering and manipulation. Another factor to consider are the needs of a particular mapping application. In driving directions applications, for example, where most map requests return unique geography, there is little reason to cache vector coordinate information at the client. Alternately, many social-demographic mapping applications, especially thematic mapping and atlases, focus on a particular area, and map rendering repeatedly uses the same set of geographic coordinates (at least for the base map). For such circumstances, the "data case" offers clear performance and interactivity advantages, as browsers typically provide automatic caching mechanisms that speed up access to recently used data.
Within the "data case" - our focus in this paper -map rendering software is either pre-installed on the client computer, or is downloaded each time along with map information (Java applets, ActiveX, etc.). The introduction of XML-based vector graphics standards and applications has made this approach even more attractive. First, the client now can be relatively lightweight and easily programmable with JavaScript or similar. Second, the client environment is fairly generic: consider for example an SVG-based client supporting any SVG-aware application, versus client software or browser plug-ins provided as part of ArcIMS Java Viewer, Intergraph's GeoMedia Web Map, or AutoDesk's MapGuide which all support a single application. Third, this client is interoperable, with well-defined standards-based interfaces allowing it to connect with various server software, databases, Web services, etc.
The technical limitations of the mainstream "picture case" architecture, and the advantages of XML-based map rendering techniques mentioned above, have interesting social implications. Many organizations, especially those engaged in neighborhood planning and community development efforts, often cannot afford the expense of server-side mapping solutions (including costs of server and network hardware, connection charges, and Internet Map Server software). Underpowered map servers tend to fail especially during community training sessions, when subject to multiple simultaneous requests in a classroom setting. Until the advance of inexpensive client-side mapping solutions, this has lead to many local community development stakeholders being excluded from interactive map publishing, reinforcing a de-facto "digital mapping divide" [12]. The new XML-based graphic technology provides an affordable way of map publishing for such neighborhoods and community groups, non-profit agencies, small companies, as well as organizations relying on common hosting ISPs. Our experience in providing affordable web mapping software to community-oriented non-profit organizations is described later in the AxioMap applications section.
XML (eXtensible Markup Language) [8] provides a flexible platform- and vendor- independent format for exchanging information between heterogeneous systems over the Internet. Several XML-based grammars for 2D vector graphics have been proposed to the World Wide Web Consortium (W3C). Among them are the Vector Markup Language (VML)[9] implemented in Microsoft's Internet Explorer 5 and above, Precision Graphics Markup Language (PGML) and, eventualy, the Scalable Vector Graphics (SVG). The SVG 1.0 specification became a W3C recommendation, and is now supported by several authoring environments and viewers. The applications described in this paper use VML and SVG. Adobe SVG Viewer 3.0 is used to render SVG content in Web browsers.
AxioMap, or Application of XML for Interactive Online Mapping, is a generic online atlas application capable of map rendering from multiple spatial and attribute data sources represented as XML files or XML-wrapped sources. It consists of two parts: an ArcView GIS extension that converts ArcView themes into XML files, and a DHTML viewer (initially using VML in IE5+, now also SVG with Adobe SVG 3.0 plug-in). The VML and SVG viewers provide similar functionality: (1) choropleth mapping from several datasets, with user-defined parameters (such as classification method, number of intervals); (2) display of additional point, line and polygon layers that can be rendered from pre-built XML files or dynamically generated from databases; (3) speech-enabled tooltips, with the text-to-speech plug-in from www.speaksforitself.com (VML only); (4) ability to create and save derived variables; (5) building simple and complex queries and mapping query results; (6) feature labeling and simple buffering; (7) customizable print layouts (VML only); (8) plenty of customization capabilities, for both the map and the navigation interface; and (9) ability to define hyperlinks for any object on a map.
With this functionality, the DHTML code is only 38K (VML version) or 26K (gzipped SVG) in size. Multiple demos, and a downloadable version, are available from http://www.elzaresearch.com/landv/. Below, we focus primarily on the SVG version of the viewer.
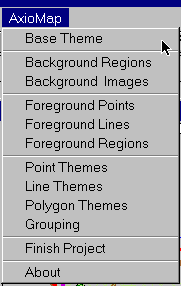
To publish an interactive map on the Internet, one needs to create a set of XML files by running AxioMap extension for ArcView GIS. The extension menu is shown in Figure 1. Each entry in the menu creates or updates one or more XML files with geometric and attribute information, using the data from ArcView themes. In addition, the ArcView extension creates a project organization file with names, locations and rendering styles of all layers registered to the map, and general map rendering instructions (map title, extent, annotation, projection, coordinate translation scheme, several GUI elements for the initial map view, etc.). The general outline of layers that AxioMap can render is shown in Figure 2.
Figure 1: The AxioMap 1.2.8 extension pull-down menu in ArcView
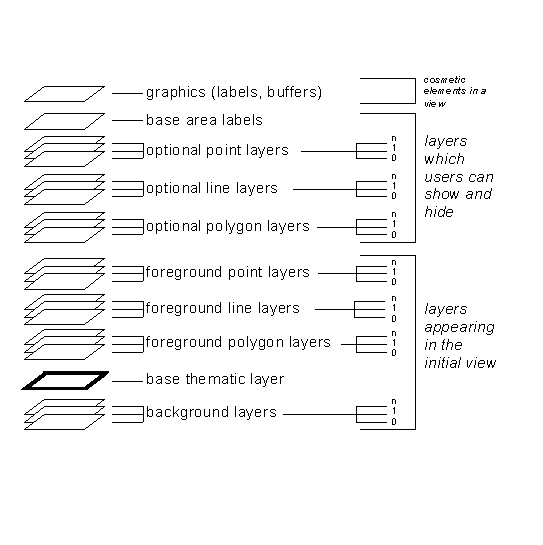
Figure 2: Outline of layers and rendering order in AxioMap viewers
The XML files generated by ArcView, are copied into a new map folder on a web server, along with html files referencing the map frameset (for the VML viewer) and an SVG template file (for the SVG viewer).
The structure of XML files ready to be served as an interactive map is shown in Figure 3. Being an atlas application rather than a generic map viewer, AxioMap stores all common project data (such as projection information, coordinate conversion formulas, symbolization, etc.) in a separate XML file (project file). XML files for individual layers can reside in the same directory, or anywhere on the Web, as referenced from the project file.
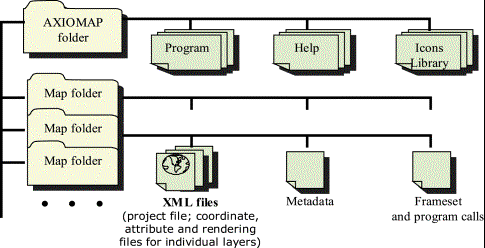
Figure 3: File organization of the AxioMap viewer
While the system described here was developed prior to release of GML drafts, it adheres to similar principles. AxioMap uses a simpe DTD (Document Type Declaration) to represent geographic feature collections as XML documents. Compared to GML which is tuned to platform-independent storage and exchange of geographic data, the AxioMap DTD is tuned to efficient feature rendering of interactive maps in atlas applications. However recasting GML files in AxioMap DTD, and vice versa, appears straightforward with XSLT [10].
Coordinates of geometric shapes are recorded in data files as integers with five digits or less (i.e. in relation to false origin whose geographic coordinates are stored in the project file). With typical screen resolutions up to 1600x1200 pixels, such coordinate encoding provides enough visual quality during zooming. The coordinate translation scheme contained in the map project file allows re-computation of these numbers into approximate geographic coordinates "on the fly".
Each XML file representing a particular layer contains coordinate strings for geographic features in this layer. For example, XML files for area layers represent a list of area records each of which contains the area ID, name and strings of vertex coordinates for polygons that compose the area. For the base area layer, area records can be linked to one or more attribute datasets also possibly residing on different servers as XML files. A fragment of an XML document with geometric information about San Diego neighborhoods is shown in Figure 4.
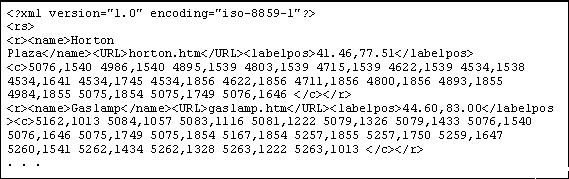
Figure 4: A fragment of an XML document with information about two San Diego neighborhoods. Each neighborhood has a label (name), label position, an optional URL, and a list of coordinate pairs.
AxioMap web map viewer opens with a version selector page, which is modified from Adobe's SVG autoinstall page available at http://www.adobe.com/svg/workflow/autoinstall.html. It checks browser type and version, and determines whether the SVG plug-in is present. If the browser supports VML (i.e. it is Internet Explorer 5 or above), the selector offers a choice between the SVG and VML viewer versions. Otherwise, it attempts to load the Axiomap SVG viewer page. As noted above, the functionality and GUI of the VML and SVG versions are similar. However, they differ significantly in performance, SVG being much faster with larger volumes of vector data; and VML being slightly more efficient handling large background images.
The AxioMap SVG viewer is implemented as a single SVG file, using ASV's internal scripting engine, to ensure that it works even in browsers without browser-plugin communication. The frame organization of a typical map viewer (i.e. separate scrollable frames for layer list/navigation and the map itself) is replicated in SVG image using two main groups of graphic elements:
A snapshot of the viewer is shown in Figure 5
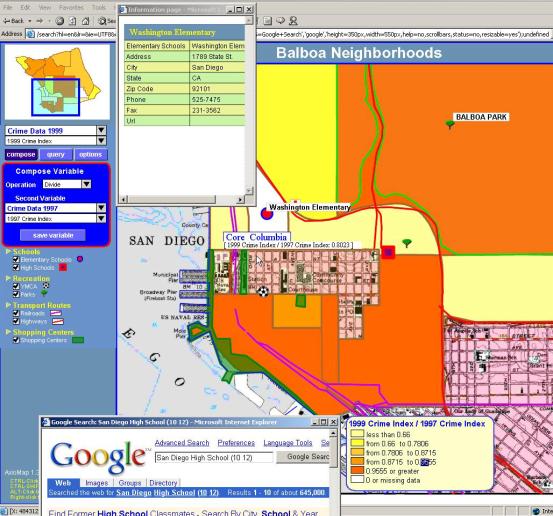
Figure 5: This is a viewer snapshot, with a portion of downtown San Diego and some thematic layers (Data from the Quality of Life San Diego project). The navigation graphics to the left of the map includes a navigable overview map synchronized with the main map; drop-down boxes for selecting attribute datasets and variables for choropleth mapping; a set of buttons for computing and saving derived variables, querying, and setting map options, and a hierarchically organized list of map layers. The main map shows several map layers turned on, and a few point labels. Results of "identify" and "search web" requests are in separate windows.
Several SVG design decisions and snippets of pseudo code may be of interest to SVG developers:
At the beginning, the AxioMap viewer loads a template SVG file, with initially empty groups for permanent and optional point, line and area layers. On initialization, project description file and system messages are loaded. The content of both the navigation and map frames is generated "on the fly" from information in the project file. In particular, the navigation graphics include an overview map, a list of layers and layer groups specified in the project file, and a set of expandable dialog boxes (see Figure 5).
Once the navigation graphics is constructed, the viewer sequentially loads permanent layers specified in the project file, as reflected in the following four functions that control the loading order and timing (in pseudo code):
project_loading = true;
function load_layer() {
	getURL(url, render_layer)
}

function render_layer() {
	// rendering code for different layer types
	if(project_loading) load_next()
}

function load_next () {
	currentLayer_number++;
	for currentLayer_type:
	if (currentLayer_number < countOfLayers_for_this_type)
		load_layer()
	otherwise
		loadNextLayerType() or
		finishLoading() 	//if no more layer types left
}

function loadNextLayerType() {
	if (at least one layer of this type is defined in the project file)
		load_layer();
	otherwise
		loadNextLayerType();
}
After all layers are loaded the "map" group is assigned mouse events, the width of navigation graphics is adjusted, and the map is ready to respond to user interaction.
As mentioned above, several graphic elements (within the "stables" group) have to be compensated on document's zoom and pan events, as follows:
var b = document.getElementById("stables");
var r = document.rootElement;
var s = 1/r.currentScale;
b.setAttribute( "transform", "scale(" + s + "," + s + ") translate(" + (-r.currentTranslate.x) +"," + (-r.currentTranslate.y) + ")" );
all_rescale();
}
where the all_rescale() function rescales labels, changes size of point symbols and width of lines, plus adjusts the overview map. All these elements are scaled in proportion to log(2.1) of the current map scale - so that when the user zooms in, the size of points, lines and labels increases only slightly.
For example, stroke-width, depending on the current zoom level, is computed as:
log2_1(1.1+(1/document.rootElement.currentScale))*(initialStrokeWidth/mapScale)
where:
the mapScale variable is the ratio of available screen width or height (in pixels) to map extent in map coordinates (dependent on map aspect ratio), the initialStrokeWidth variable is a symbol's stroke width defined by the user in the project file, and
function log2_1(x) {
return Math.log(x)/Math.log(2.1)
}
Different map elements will trigger different content of the context menu, which is updated with onmousedown="set_menu()" on the <svg> element. For example, the default zoom controls, as well as labeling and identify functionality are disabled when the context menu is invoked over the navigation graphics (see context menu on Figure 6).
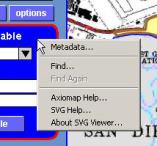
Figure 6: Context menu outside the map frame.
When invoked over the map, the context menu looks like in Figure 7.
Figure 7: An example of a context menu over a point symbol.
Nearly half of the code in the AxioMap SVG viewer deals with SVG implementation of standard GUI and form elements: buttons, drop-down boxes, text areas, scrollbar, etc. In most cases, we modified code snippets found on the Web (for example, we modified vertical scrollbar by Peter Sorotokin, and textarea graphics by Scott Straley). Please see the viewer code for examples. Echoing sentiments expressed by many developers, we look forward to SVG viewers' integration with XForms and/or native SVG implementations within browsers which should solve this problem.
AxioMap has been used by several non-profit organizations to present quality of life variables and support community awareness of health and social issues. Examples are the Quality of Life in San Diego, a data warehousing and community web mapping portal project (http://www.qolsandiego.net/), and the Neighborhood Indicators project by the Baltimore Neighborhood Indicators Alliance (http://www.bnia.org/). Non-profits are attracted by the ease of creating Web maps with AxioMap, very light server hardware requirements, and low costs. From the Quality of Life San in Diego portal, for example, community users can access a wealth of information about their neighborhoods, including 11 interactive maps of San Diego Community Collaboratives, and several more detailed community mapping projects. Each Quality of Life map enables community users to develop choropleth maps of about 300 variables (demographics, housing, ethnic and income composition, occupation and employment, land patterns, crime, forecast data from a local planning agency, etc.) and any arithmetic combinations of these variables, and display three dozen line and point layers (roads, hospitals and recreation centers, parks, drug treatment centers, government agencies and non-profits, churches and community centers, libraries and museums, etc.). Additionally, users can query Quality of Life data warehouse (Web interface implemented with ColdFusion) and map query results in AxioMap (http://www.qolsandiego.net/datawarehouse/level2/index.cfm).
Another area where AxioMap has been used extensively is prototyping and demonstration of various XML-based technologies, including XML wrapping of spatial data sources, XML-based spatial mediation, and ontology management. Within the MIX (Mediation of Information using XML) project of the San Diego Supercomputer Center [1], AxioMap is used as a spatial information mediation client. The purpose of a mediation system is to give a user the ability to issue a single query to access multiple heterogeneous geographic sources and services, retrieve different pieces of the result, and seamlessly assemble these pieces into a composite response [2,3,11]. Homogeneity in the system is accomplished by different sources and services exposing their schemas and capability records in XML, with help of XML wrappers. In our demo system, user queries are formulated from AxioMap interface and sent to a mediator which is responsible for generating a query plan and orchestration query execution. Query results, in XML format, are then returned by the mediator to the AxioMap for rendering. Consider the following sample query:
Find school districts in San Diego where computer ownership rates among residents are over 80%
which is executed over two data sources with associated Web services:
The sample query starts by finding cities with computer ownership among residents over 80% - by retrieving a cross-tabulation between the two survey questions mentioned above. Then the mediator passes the selected cities on to the spatial server, which finds school districts that intersect with the selected cities. At the last step, the coordinates of the selected school districts are written out as an XML string, and sent to AxioMap for rendering. The general framework for answering this query is shown in Figure 8.
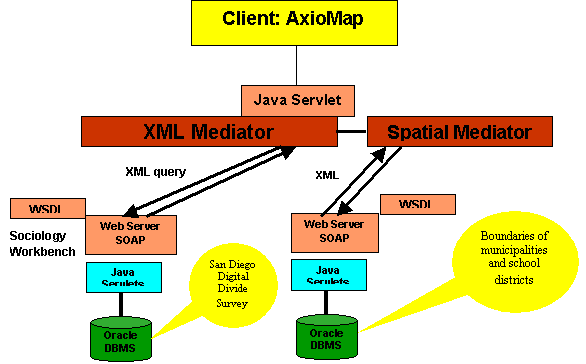
Figure 8: Wrapper-mediator architecture for answering complex queries against heterogeneous sources, with an AxioMap client.
This and other spatial mediation demos can be found at http://gis.sdsc.edu/dgo/.
As AxioMap-based interfaces appeared to be a convenient environment for quick prototyping of spatial query and markup interfaces over collections of federated spatial data sources, we extended our use of SVG to projects not necessarily dealing with geographic data. One such extension is the Spatial Markup and Rendering Tool (SMaRT) developed for managing and querying neuroanatomy atlases, and supporting the atlas conversion into a spatial database. Sections of brain atlases of rat [6] and mouse [7] were converted into SVG files from Adobe Illustrator, and accessed via a DHTML interface which allowed users to:
In developing this system, we ran into several interesting problems of spatial database creation from unorganized SVG shapes. The main issues are: (a) reformatting SVG paths so that they can be entered in a spatial database (Oracle Spatial), with automatic detection of semantic and spatial inconsistencies, (b) associating SVG paths with labels and attribute databases, and (c) coordinate system conversions (between screen coordinates, SVG coordinates, and stereotaxic coordinates) triggered by particular spatial queries.
Both brain atlases come with a CD containing Adobe Illustrator versions of the atlas line drawings. We converted all atlas plates into SVG files, and added an interface that allows users to browse the brain slices, loading them as needed, and interact with the graphics. As a particular slice loads, the interface adds event listeners and computes the coordinate system of the slice. Coordinate system computation is based on finding paths of axis tick marks, and retrieving their SVG coordinates. Based on these values, we can compute approximate horizontal and vertical scales, and translate SVG coordinates into the common stereotaxic coordinate system of the atlas. Once the coordinates are known, user interactions with databases are conducted in stereotaxic coordinates.
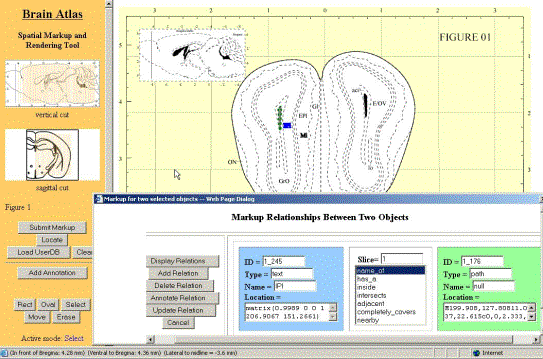
Figure 9: SVG interface of the Spatial Markup and Rendering Tool. Users can markup relationships between selected path and text elements, add graphic annotations, locate labeled features across slices, and query relationships between features. The status bar shows mouse location in 3D stereotaxic coordinates. Plate from the mouse brain atlas [7]
With the SMaRT tool, a user can select geometric paths and text elements and specify relationships between them, as shown in Figure 9. Additionally, the user can define a polygon representing a brain region and label it, selecting an appropriate concept from one or more ontologies. As the ontology source, we have been using the Unified Medical Language System (UMLS) developed by the National Library of Medicine [#41]. This technique allows us to turn the atlas into a spatial database, for subsequent querying from the same browser interface. However, manual feature labeling with SMaRT proved to be quite time-consuming. Thus, we proposed a new semi-automatic procedure for associating SVG paths and text elements and organizing them into a spatial database. To limit possible associations between geometric features and labels, the procedure finds spatial relationships between elements in an SVG image, as well as relationships among labels organized in a semantic hierarchy. The problem is modeled below.
Suppose our source SVG file contains an unorganized set of lines, and text labels. Line paths may represent straight segments, Bezier curves, arcs, etc. and are described in a rectangular coordinate system. Some lines are closed and can be interpreted as polygons. Labels are represented by small rectangles in the same coordinate system. Most (but not all) features have associated labels, but we don't know which feature is associated with which label. A typical picture is shown in Figure 10, a fragment from [6].
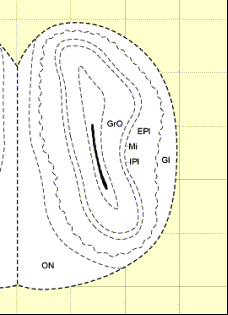
Figure 10: A fragment of SVG graphics, with path and text elements, initially not associated with each other.
Additional information that we have about labels is contained in a "domain ontology" of anatomical concepts, such as UMLS mentioned above.
The problem can be formalized as follows:
For each line feature Fi, find the most appropriate text label Tj, using information about relationships between the text labels in the domain map R{T}, spatial relationships between geometric features R{F}, and spatial relationships between features and labels R{LT}.
We model this representation as follows.
1. Feature semantics. Lines may represent three types of features, each of which can have associated text labels:
2. Label semantics. A label may apply to the entire polygon or boundary line, or to portions of polygons or boundary lines. In other words, the assignment of labels to geometric features may follow strict topological consistency rules, or may include some relaxing conditions. In the former case, an anatomical feature should have exactly one label. This situation is well studied in GIS literature, with planar enforcement approaches implemented in various GIS software. In the latter case, a feature may have more than one label, as long as these labels are not in conflict as specified in a domain map. Figure 11 illustrates the two situations.
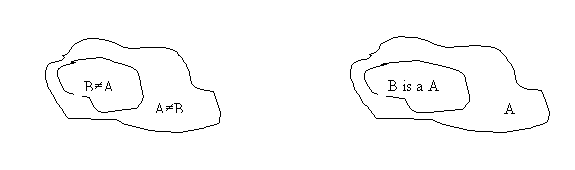
Figure 11: . Possible semantics of features and labels: in the first case only identity relationship is allowed between A and B, and a polygon may have a single label only; in the second case "is a" relationship is also allowed. Consequently, if the boundary of B is missing or not closed, it is considered an error in case a) and not an error in case b).
3. Relationships between features and labels. Let's consider a
relationship R between a feature F and text label T. Our
starting notion is that any feature F may be related to any label
T: 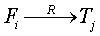 . Suppose that we consider only "is a"
relationship, so the semantics of R is fixed.
. Suppose that we consider only "is a"
relationship, so the semantics of R is fixed.
Since we know the coordinates of both features and labels, we can constrain this relationship further by requiring that features can be associated with labels if they are near each other:
Distance (GFi, GTj) < e
where GF stands for a geometric description of the feature (referenced by a list of coordinates), and GT is a geometric description of the text label (the label's bounding box).
Note that for closed lines representing a polygon of an anatomic feature (case F1) we specify that if GTj is inside GFi, then Distance (GFi, GTj) = 0.
Labeling geometric features in Figure 10 from 0 to 6 from the inside, we, therefore, obtain the following set of relationships:
Inside(GrO, 2)			Not_inside(Gro,1)
Inside(Ep1, 4) 			Not_Inside(Ep1, 3)
Inside(Mi, 4)			Not_Inside(Mi, 3)
Inside(Ip1, 4)			Not_Inside(Ip1, 3)
Inside(Gi, 5)			Not_Inside(Gi, 4)
Inside(On, 6)			Not_Inside(On, 5)
4. Relationships among text labels. A domain map provides us with two types of relationships between labels: (1) the "is a" relationships in a domain map, and (2) spatial relationships contained in the text of the label itself. For example, two labels from the first slice of the Brain Atlas (Figure 10) have the following descriptions:
EP1: external plexiform layer of the olfactory bulb
IP1: internal plexiform layer of the olfactory bulb,
from which we deduce that Inside(IP1.geom, EP1.geom)
5. Geometric relationships between features. Spatial relationships between polygons and lines have been described in several recent spatial reasoning studies [e.g. 4]. In a drawing typical of a brain atlas, we are considering primarily "inside", "not inside" and "adjacent" relationships between polygon interiors, boundaries and exteriors. In particular, labeling geometric features in Figure 10 from 0 to 6 from the inside, we arrive at a set of rules such as:
Inside(0,1), Inside(1,2), Inside(2,3), etc.
The task of the algorithm then is to retain only those associations between
features and labels from the complete set , which
satisfy both semantic and spatial constraints. The detailed description of the
algorithm is beyond the scope of this paper.
Summary
In our projects, SVG has shown remarkable potential for being a programming environment of choice for supporting extensive user intreraction and easy integration with other standards-based XML technologies. We demonstrated several SVG clients, working with both dynamically generated and materialized XML data, within a standalone map viewer application and a more complex information integration system.
[1] Baru, C., Gupta, A., Ludaescher, B., Marciano, R., Papakonstantinou, Y., Velikhov, P. and Chu, V. (1999) "XML Based Information Mediation with MIX". Proc. of the ACM SIGMOD 1999, June 1-3, Philadelphia, PA, USA, pp. 597-599.
[2] Gupta, A., Marciano, R., Zaslavsky, I., Baru, C. (1999) "Integrating GIS and Imagery through XML-Based Information Mediation". In P. Agouris and A. Stefanidis (Eds.) Integrated Spatial Databases: Digital Images and GIS, Lecture Notes in Computer Science, Vol. 1737. Preliminary version available at http://www.npaci.edu/DICE/Pubs/isd99.pdf.
[3] Gupta, A., Zaslavsky, I., and Marciano, R. (2000) "Generating Query Evaluation Plans within a Spatial Mediation Framework", Proceedings of the 9th International Symposium on Spatial Data Handling, Beijing, China, August 10-12, 2000. Available at http://www.sdsc.edu/~zaslavsk/pubs/sdhsv2000.pdf.
[4] Egenhofer, M. and Franzosa, R. "Point-set Topological spatial relations". International Journal of Geographical Information Systems, 5(2):161-174, 1991.
[5] Open GIS Consortium (2000) OpenGIS Web Map Server Interface Implementation Specification. Available at http://www.opengis.org/.
[6] Paxinos and Watson (1998) "The Rat Brain in Stereotaxic Coordinates", Academic Press.
[7] Paxinos and Franklin (2000) "The Mouse Brain in Stereotaxic Coordinates", Academic Press.
[8] W3C (1998) Extensible Markup Language (XML) 1.0. W3C Recommendation, 10-February-1998. Available at http://www.w3.org/TR/1998/REC-xml-19980210.
[9] W3C (1998) "Vector Markup Language (VML)", World Wide Web Consortium Note 13-May-1998. Available at http://www.w3.org/TR/NOTE-VML.
[10] W3C (1999) "XSL Transformations (XSLT), Version 1.0". W3C Recommendation, 16 November 1999. Available at http://www.w3.org/TR/xslt.
[11] Zaslavsky, I., Marciano, R., Gupta, A., Baru, C. (2000) "XML-based Spatial Data Mediation Infrastructure for Global Interoperability". Proceedings of the 4th Global Spatial Data Infrastructure Conference, Cape Town, South Africa, 13-15 March 2000. Available at http://www.npaci.edu/DICE/Pubs/gsdi4-mar00/gsdi_iz.html.
[12] Zaslavsky, I. (2000). "A New Technology for Interactive Online Mapping with Vector Markup and XML". Cartographic Perspectives, # 37 (Fall 2000), pp. 65-77. Preliminary version available at http://www.sdsc.edu/~zaslavsk/pubs/CP_37_zaslavsky.pdf.
[13] Zaslavsky, I., Sensenig, P., Forkenbrock, D. (2001) "Mapping a Future for Digital Connections: A Study of the Digital Divide in San Diego". San Diego Regional Technology Alliance. Available at http://www.sdrta.org/downloads/digitaldividereport.pdf.