home family work school resume
Results
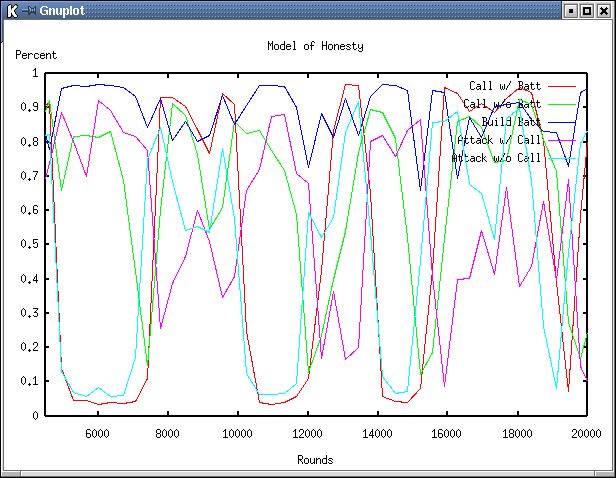
For reference: these were the values in make_config
6 1 -1.500000 -2.500000 0.500000 -2.000000 0.500000
This graph shows the beginning of oscilations between a
creatures inclinations to use one form of communication over another.
The prey starts off by communicating its building of battlements by
being silent. At this point it is silent a majority of the time that
it builds battlements. Because of this it can be seen that the predator
is attacking primarily when a call is given because a given call can be
interpreted as a bluff. The prey calling without building battlements
is being selected against as can be seen by the decline in the green line
to the point where is it low enough that it is equally advantageous for
the predator to attack when no call is heard. This puts pressure on the
prey to use the call to accurately represent his building of battlments.
Thus we the attacking without calling and calling with building switching
places with attacking with calling and calling without building.
Here is the same graph, further on in the simulation. As can be seen, it has gone into a steady of steady oscillation. An especially salient feature of it is the close pairing of the red and light blue lines. Representing the prey calling while attacking and the predator attacking without a call being made, it can be seen when that the two follow each other closely when their values are low. This is because when the prey is not calling when making battlements (the red line is low) it is sending its most "honest" signal. This is illustrated by looking at when the value for calling while making battlements are high. When this is true, it is also the case that the value for making a call without battlements in place is also high. With both values high the predator does not have as clear an idea of what a call represents. The preys value for calling without battlements in place never stays low for long because when it goes low, the predator will take more seriously a call, and not be as likely to attack the prey when the prey calls. This selects for both the call with, and without battlements in place, which explains why there is more noise when the prey is calling while building battlements.